Criterion 8 – Output and Outcomes
Criterion
Requirements

Quality level assessment

Result
8.1 The pass rate, dropout rate, and average time to graduate are shown to be established, monitored, and benchmarked for improvement.
Operational Result
BEDM programme has total approved capacity of students = 30.
The BEd-Mathematics Program with its pool of advisors closely monitors every student as part of the faculty’s “No Ed Student Left Behind” initiative to ensure that all students graduate within the target year. The pass rate, dropout rate, and average time to graduate are established, monitored, and benchmarked for continuous improvement.
Monitoring System: Advisors regularly review each student’s academic progress, providing personalized support and interventions when necessary to help them stay on track. This includes frequent meetings, academic counseling, and tailored study plans. Each student also has E-portfolio where advisers, including the Dean of the Faculty, can monitor each student progress.
Benchmarking: The Program benchmarks these data against both internal and external student records from comparable programs and years to identify areas for improvement. Regular reports are generated to track progress and highlight trends, to identify areas to be improved.
Continuous Improvement These efforts include curriculum adjustments, enhanced tutoring services, peer mentoring and the implementation of new teaching strategies to address identified issues. These measures ensure that students receive the support they need to succeed and graduate on time.
The data below shows the number of final-year students and the total number of graduates, demonstrating the effectiveness of these efforts:
Benchmarking of Students’ Admission, Drop – out, Retention and Passed
Table 8.1(1):
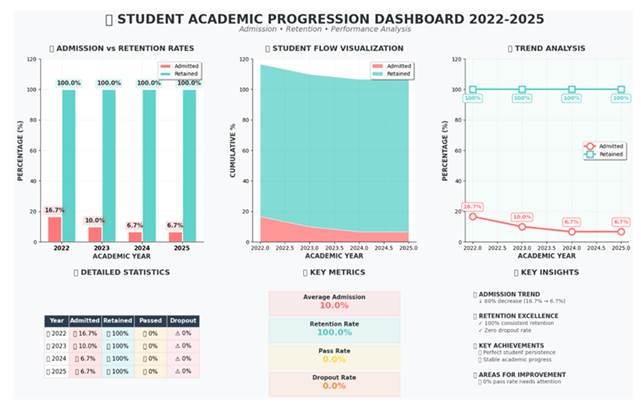
Benchmarking of Students’ Rate of Admission, Drop – out, Retention and Passed
Table 8.1(1): No. of Students’ Admission in each Year and Number of Students Retention after each Year:
| Accepting Year | 2022 | 2023 | 2024 | 2025 | Remark |
| 2022 | 05 | 05 | 05 | 05 | Pursuing |
| 2023 | 03 | 03 | 03 | Pursuing | |
| 2024 | 02 | 02 | Pursuing | ||
| 2025 | 02 | Pursuing | |||
| TOTAL | 05 | 08 | 10 | 12 |
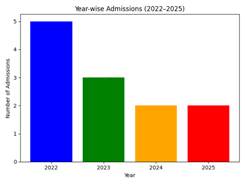
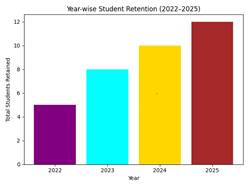
Table 8.1(2): Students’ Rate of Admission, Drop – out, Retention and Passed per Academic Year
| Year | Percentage of Students Admitted [A], Drop-out [D], Retained [R], Passed [P] (per Academic Year) | |||||||||||||||
| 2022 | 2023 | 2024 | 2025 | |||||||||||||
| A | D | R | P | A | D | R | P | A | D | R | P | A | D | R | P | |
| 2022 | 16.7 | 0 | 100 | 0 | ||||||||||||
| 2023 | 0 | 100 | 0 | 10 | 0 | 100 | 0 | |||||||||
| 2024 | 0 | 100 | 0 | 0 | 100 | 0 | 6.7 | 0 | 100 | 0 | ||||||
| 2025 | 0 | 100 | 0 | 0 | 100 | 0 | 0 | 100 | 0 | 6.7 | 0 | 100 | 0 | |||
8.2 Employability as well as self-employment, entrepreneurship, and advancement to further studies, are shown to be established, monitored, and benchmarked for improvement.
Operational Result
Our program excels in ensuring the employability of our graduates, with comprehensive systems established, monitored, and benchmarked for continuous improvement. Recognizing the dynamic and competitive nature of today’s world. This system ensures our graduates are equipped with the necessary skills, knowledge, and opportunities to thrive in their career outside the university. Through continuous feedback from their employers and benchmarking, we maintain and enhance the quality and relevance of our program, making employability one of its main strengths.
Employability: We have a strong track record of graduates successfully securing employment in their field of study.
There are three (3) in 2024 graduates. Out of the recent 3 graduates, 3 or 100% responded to the survey questionnaire. These three (3) graduates have reported (100%) successful employment (one joined in school, one joined in corporate sector, and one joined in his family business). This positive outcome underscores the effectiveness of our program in preparing students for the workforce and highlights the alignment of our curriculum with the school’s needs. The employment status of these graduates serves as a testament to the quality of education and career readiness that our program provides, reflecting the commitment to ensuring our students’ professional success.
For the year 2023, our Graduates Employment Rate is 100 %=5 Marks
The calculation below shows that all of the BEd- Mathematics graduates who responded to the survey of the year 2024 were employed or self-employed.
Calculation:
1. (Number of Bachelor Graduates who are employed or self-employed within 1 year*100 )/ Total number of Graduate Survey
Respondents Total no. Graduates = 3
No. of Graduates who responded = 3 (100%)
Graduates Employed & Self-employed= 3
3×100/3 = 100%
2. Percentage of Bachelor Graduates who are employed or self-employed within 1 year*5/100
= (100*5)/100= 5.0
Monitoring and Benchmarking: To ensure continuous improvement, we implement the following:
- Alumni Surveys: Regularly collecting feedback from graduates about their employment status, job satisfaction, and career progression through our alumni group and committee.
- Employer’s Feedback: Engaging with employers to gather insights on our graduates’ performance and identify areas for curriculum enhancement.
- Benchmarking: Comparing our employability metrics with leading programs globally to maintain high standards and drive improvements.
Concrete Results: One of the main strengths of our programme is the high employability of our graduates. Through our monitoring and benchmarking, we continuously refine our approach to ensure our students are well-prepared for their careers outside the university.
8.3 Research and creative work output and activities carried out by the academic staff and students, are shown to be established, monitored, and benchmarked for improvement.
Operational Result
The BEd – Mathematics Programme includes three courses – research, project and seminar in two semesters where students study about the relevant topics and pursue research and project works and learn how to present research topic or project in a seminar. Topics of research and project may be chosen from the subjects of study they were being taught or from teaching internship programme. The BEd-Mathematics programme emphasizes on the importance of research and creative work output both by academic staff and students. These activities are not only established but also actively monitored and benchmarked for continuous improvement. Our staff and student creative work are showcased during our Annual Academic Expo, one of our most successful activities in promoting creativity among students and staff.
Establishment and Monitoring:
- Faculty Research Projects: Academic staff are engaged in ongoing research projects that contribute to the advancement of knowledge in their respective fields.
- Student Research Initiatives: Students are encouraged to undertake research and projects under the guidance of faculty mentors.
Benchmarking for Improvement:
- Student Output Showcases: Student Creative works are showcased during events such as the Academic Expo, providing a platform for recognition and feedback from peers and stakeholders.
- Benchmarking: We benchmark our student creative works against external standards, seeking external recognition and approval to validate the quality of our outputs.
Encouraging Independence and Innovation
- Student-Led Projects: Students are empowered to take ownership of their learning through self-directed projects.
- Mentorship and Guidance: Faculty members and seniors provide mentorship and guidance to students, ensuring that their creative works are not only innovative but also grounded in sound academic principles.
Student Research Output:
Kaleidoscope: A collection of Lived Movements
by Ekta Rana (Author, Editor) Format: Kindle Edition
Kaleidoscope: A Collection of Lived Movements brings together a series of personal memoirs written from moments that quietly shaped young lives. These are not grand heroic stories, but intimate records of fear, courage, family, friendship, loss, belonging, and self-discovery. Each narrative begins from an ordinary experience: a classroom, a festival, a family meal, a journey, a pet, a mistake, or a difficult night, and gradually opens into a deeper lesson about life.
Like a kaleidoscope, the book gathers many voices, colours, emotions, and memories. Every story turns differently, yet together they form a shared pattern of growth. The writers look back at moments when they felt uncertain, afraid, lonely, or overwhelmed, and show how those moments became sources of strength, confidence, and understanding.
This collection celebrates lived experience as a form of learning. It reminds readers that identity is not formed only through major achievements, but also through small acts of kindness, quiet bravery, family bonds, painful goodbyes, and the courage to continue.
8.4 Data are provided to show directly the achievement of the programme outcomes, which are established and monitored.
Operational Result
Based on the feedback from our various stakeholders, we can directly demonstrate the achievement of our program outcomes, which are both established and consistently monitored. Our students’ performance provides clear evidence of this success across multiple dimensions.
High Score on Standard English Tests (TOEIC) .Firstly, our students consistently achieve high scores on the TOEIC (Test of English for International Communication). This benchmark not only underscores their proficiency in English but also demonstrates their readiness to engage in global communication and professional environments.
Government Exam for Assistant Teacher Position Performance. Secondly, our students excel in government exams, frequently topping these assessments. This achievement reflects their comprehensive understanding of the subject matter and their ability to apply their knowledge effectively in standardized testing scenarios. It is a testament to the rigorous academic preparation and support provided by our program.
Awards & Recognition from local and International Organization
Additionally, our students have secured placements in several prestigious local and international contests. These accomplishments span various disciplines and highlight their ability to compete at high levels, demonstrating their critical thinking, creativity, and problem-solving skills. Such placements are a clear indication that our students are not only absorbing information but are also able to apply their learning in diverse and challenging contexts.
These indicators—high TOEIC scores, top performance in government exams, and success in local and international contests—collectively demonstrate that our program learning outcomes are being achieved. This feedback from our stakeholders confirms that our educational strategies are effective and that our graduates are well-prepared for both local and international opportunities. Our continuous monitoring and assessment processes ensure that we maintain and improve the quality of education we provide, ultimately contributing to the ongoing success and recognition of our students and our program.
Further, the BEDM programme expected outcomes of 4 aspects attainment of the graduates, including mean score of perceived achievement of overall PLOs. The results of the satisfaction of employers towards our student performance, Table below, show clearly that program expected learning outcomes are achieved. The faculty has conducted employer’s Satisfaction of our students’ performance at work for 5 years of comparative view. The comparative view of average scores of the survey in the three (3) aspects shows Very Good Satisfaction.
As shown in the data table below, the assessment results of students learning outcomes in all aspects are higher than 3.51.
The five 5 aspects of learning outcomes in accordance with the Thai Qualifications Framework for Higher Education. our graduates participated in the survey. The table below shows the graduate quality assessment, a comparative view for 5 years of survey which clearly shows a gradual achievement of results:
Table 8.4: Employers’ Satisfaction Survey on Graduates’ Services for 5 Years
Part – 1: Satisfaction on Graduates’ Characteristics [as per Desirable Learning Standards of Graduates]
| Serial | Item Description | 2021 | 2022 | 2023 | 2024 | 2025 |
| 1. | Knowledge | 4.23 | 4.25 | 4.28 | 4.25 | 4.26 |
| 2. | Skills | 4.07 | 4.12 | 4.16 | 4.22 | 4.24 |
| 3. | Ethics | 4.10 | 4.21 | 4.23 | 4.20 | 4.21 |
| 4. | Characters | 4.18 | 4.20 | 4.20 | 4.24 | 4.25 |
| Total Mean Score | 4.14 | 4.19 | 4.22 | 4.23 | 4.24 | |
Part – 2: Satisfaction with Graduates [as per Results of Learners] [as per ONESQA]
| Serial | Item Description | 2021 | 2022 | 2023 | 2024 | 2025 |
| 1. | Knowledgeable Person | 5.00 | 4.40 | 4.42 | 4.63 | 4.69 |
| 2. | Creativity / Innovation | 4.20 | 4.36 | 4.38 | 4.57 | 4.55 |
| 3. | Strong Citizen | 4.20 | 5.00 | 5.00 | 4.68 | 4.70 |
| Total Mean Score | 4.47 | 4.59 | 4.60 | 4.63 | 4.65 | |
Part – 3: Satisfaction of English Language Proficiency and 21st Century Skills of Graduates
| Serial | Item Description | 2021 | 2022 | 2023 | 2024 | 2025 |
| 1. | English Language | 4.00 | 4.18 | 4.18 | 4.20 | 4.24 |
| 2. 21st Century Learning Skills | ||||||
| i.. | Learning Skills and Innovation | 4.28 | 4.20 | 4.21 | 4.27 | 4.25 |
| ii.. | Media and Technology Skills | 4.00 | 4.20 | 4.22 | 4.30 | 4.29 |
| iii.. | Skills in Living and Profession | 4.56 | 4.61 | 4.63 | 4.60 | 4.62 |
| Total Mean Score | 4.21 | 4.30 | 4.31 | 4.34 | 4.35 | |
Satisfaction level scale:
4.01 – 5.00 = Very Good
3.01 – 4.00 = Good
2.01 – 3.00 = Fair
0.00 – 2.00 = Need Improvement
8.5 Satisfaction level of the various stakeholders are shown to be established, monitored, and benchmarked for improvement.
Operational Result
The satisfaction levels of our various stakeholders are systematically established, monitored, and benchmarked for continuous improvement. Our comprehensive satisfaction surveys encompass feedback from both internal stakeholders, such as students, faculty, and staff, and external stakeholders, including alumni, employers, and schools. The satisfaction survey results of stakeholders are incorporated in the tables at the end below.
Internal Stakeholders
- Students: Our student satisfaction surveys consistently reveal high levels of contentment with the quality of education, faculty engagement, and campus resources. Areas identified for improvement include increasing access to advanced technology and expanding extracurricular opportunities.
- University Supervisor: Surveys indicate a strong sense of job satisfaction and a positive working environment. However, feedback suggests a need for enhanced professional development programs and better communication channels within departments.
External Stakeholders
Alumni: Alumni surveys show high satisfaction with the preparedness for their careers and the value of their degrees. They recommend strengthening alumni networks and mentorship programs to further support graduates’ professional growth.’
Employers: Feedback from employer’s highlights satisfaction with the competency and readiness of our graduates. They suggest incorporating more industry-specific skills and practical experiences into the curriculum.
Partner Schools: School partners express satisfaction with our students as the result of their evaluation on the performance of our shows. They recommend increasing the frequency of joint events foster deeper collaboration.
Planned Improvements
Based on the detailed analysis of these satisfaction survey results, several key improvement initiatives have been initiated by the program:
- Technology and Resources: Upgrading technological infrastructure and expanding access to advanced learning tools to enhance the overall educational experience for students.
- Professional Development: Implementing comprehensive professional development programs for faculty and staff to support their continuous growth and effectiveness.
- Alumni Engagement: Strengthening alumni networks and introducing mentorship programs to provide ongoing support and career guidance for graduates.
- Curriculum Enhancement: Integrating more industry-specific skills and practical experiences into the curriculum to better prepare students for the workforce.
- Collaborative Opportunities: Increasing the frequency and scope of joint events and workshops with industry partners to foster deeper collaboration and practical learning opportunities.
The above efforts demonstrate our commitment to continuous improvement and our responsiveness to the valuable feedback from our diverse stakeholder community. Satisfaction surveys of required stakeholders are listed in the following tables for clear views as evidence:
Table 8.5(1): Student Satisfaction Survey on Learning Support for 5 Years
| Serial | Item Description | 2021 | 2022 | 2023 | 2024 | 2025 |
| 1. | Library Services | 4.80 | 4.78 | 4.86 | 4.93 | 4.92 |
| 2. | Physical Services | 4.80 | 4.86 | 4.84 | 4.83 | 4.88 |
| 3. | Education Facilities | 4.90 | 4.96 | 4.97 | 4.95 | 4.92 |
| 4. | Safety Facilities | 4.90 | 4.87 | 4.89 | 4.89 | 4.91 |
| 5. | Student Accommodation | 4.90 | 4.94 | 4.95 | 5.00 | 5.00 |
| 6. | Advisor service | 4.78 | 4.85 | 4.88 | 4.92 | 4.96 |
| 7. | Information Service | 4.89 | 4.96 | 4.89 | 4.93 | 4.97 |
| 8. | Academic Development | 4.99 | 4.98 | 4.98 | 4.95 | 4.96 |
| 9. | Physical Environment | 5.00 | 4.93 | 4.94 | 5.00 | 5.00 |
| 10. | Other Services | 5.00 | 5.00 | 5.00 | 5.00 | 4.98 |
| Total Mean Score | 4.90 | 4.91 | 4.92 | 4.94 | 4.95 | |
Table 8.5(2): Student Satisfaction Survey towards Programme Management for 5 Years
| Serial | Item Description | 2021 | 2022 | 2023 | 2024 | 2025 |
| 1. | Officers’ Services Factors | 4.80 | 4.84 | 4.85 | 4.81 | 4.87 |
| 2. | Procedures and Steps of Services | 4.81 | 4.78 | 4.79 | 4.86 | 4.83 |
| Total Mean Score | 4.80 | 4.81 | 4.82 | 4.84 | 4.85 | |
Table 8.5(3): Lecturer Satisfaction Survey on Learning Support for 5 Years
| Serial | Item Description | 2021 | 2022 | 2023 | 2024 | 2025 |
| 1. | Library Services | 4.85 | 4.87 | 4.87 | 4.92 | 4.93 |
| 2. | Physical Services | 4.87 | 4.84 | 4.82 | 4.83 | 4.85 |
| 3. | Education Facilities | 4.79 | 4.83 | 4.90 | 4.88 | 4.90 |
| 4. | Safety Facilities | 4.84 | 4.86 | 4.89 | 4.90 | 4.90 |
| 5. | Student Accommodation | 4.95 | 4.89 | 4.90 | 5.00 | 5.00 |
| 6. | Advisor service | 4.78 | 4.87 | 4.89 | 4.94 | 4.96 |
| 7. | Information Service | 4.79 | 4.89 | 4.89 | 4.91 | 4.93 |
| 8. | Academic Development | 5.00 | 5.00 | 5.00 | 5.00 | 5.00 |
| 9. | Physical Environment | 5.00 | 5.00 | 4.94 | 4.92 | 4.95 |
| 10. | Other Services | 5.00 | 5.00 | 5.00 | 5.00 | 4.98 |
| Total Mean Score | 4.88 | 4.90 | 4.91 | 4.93 | 4.94 | |
Table 8.5(4): Lecturer Satisfaction Survey on Course Management for 5 Years
| Serial | Item Description | 2021 | 2022 | 2023 | 2024 | 2025 |
| 1. | Management and Staff Development [for relating to roles and responsibilities] | 4.89 | 4.95 | 4.95 | 4.97 | 4.96 |
| 2. | Management and Staff Development [for directing and monitoring coursework related to teaching and learning] | 4.95 | 4.93 | 4.96 | 4.94 | 4.97 |
| 3. | Teaching Process | 4.89 | 4.94 | 4.96 | 4.99 | 4.99 |
| 4. | Learning Support | 4.92 | 4.97 | 4.98 | 4.94 | 4.97 |
| 5. | Advisor System and Independent Study | 4.98 | 4.92 | 4.92 | 4.96 | 4.96 |
| Total Mean Score | 4.93 | 4.94 | 4.95 | 4.96 | 4.97 | |
Table 8.5(5): Students’ Satisfaction Survey on 21st Century Skills for 5 Years
| Serial | Item Description | 2021 | 2022 | 2023 | 2024 | 2025 |
| 1. | Learning and Innovation Skills | 4.16 | 4.12 | 4.18 | 4.24 | 4.26 |
| 2. | Information, Media and Technology Skills | 4.17 | 4.29 | 4.32 | 4.33 | 4.35 |
| 3. | Life and Career Skills | 4.57 | 4.65 | 4.66 | 4.63 | 4.65 |
| Total Mean Score | 4.30 | 4.35 | 4.37 | 4.40 | 4.42 | |
Table 8.5(6): Students’ Satisfaction Survey on Buddy System for 5 Years
| Serial | Item Description | 2020 | 2021 | 2022 | 2023 | 2024 |
| 1. | Role of Buddy System and students’ support | 4.97 | 5.00 | 5.00 | 5.00 | 5.00 |
| 2. | Effects of Buddy System in students’ learning and students’ participation | 5.00 | 5.00 | 5.00 | 5.00 | 5.00 |
| Total Mean Score | 4.99 | 5.00 | 5.00 | 5.00 | 5.00 | |
Table 8.5(7): Employers’ Satisfaction Survey on Graduates’ Services for 5 Years
Part – 1: Satisfaction on Graduates’ Characteristics [as per Desirable Learning Standards of Graduates]
| Serial | Item Description | 2021 | 2022 | 2023 | 2024 | 2025 |
| 1. | Knowledge | 4.23 | 4.25 | 4.28 | 4.25 | 4.26 |
| 2. | Skills | 4.07 | 4.12 | 4.16 | 4.22 | 4.24 |
| 3. | Ethics | 4.10 | 4.21 | 4.23 | 4.20 | 4.21 |
| 4. | Characters | 4.18 | 4.20 | 4.20 | 4.24 | 4.25 |
| Total Mean Score | 4.14 | 4.19 | 4.22 | 4.23 | 4.24 | |
Part – 2: Satisfaction with Graduates [as per Results of Learners] [as per ONESQA]
| Serial | Item Description | 2021 | 2022 | 2023 | 2024 | 2025 |
| 1. | Knowledgeable Person | 5.00 | 4.40 | 4.42 | 4.63 | 4.69 |
| 2. | Creativity / Innovation | 4.20 | 4.36 | 4.38 | 4.57 | 4.55 |
| 3. | Strong Citizen | 4.20 | 5.00 | 5.00 | 4.68 | 4.70 |
| Total Mean Score | 4.47 | 4.59 | 4.60 | 4.63 | 4.65 | |
Part – 3: Satisfaction of English Language Proficiency and 21st Century Skills of Graduates
| Serial | Item Description | 2021 | 2022 | 2023 | 2024 | 2025 |
| 1. | English Language | 4.00 | 4.18 | 4.18 | 4.20 | 4.24 |
| 2. 21st Century Learning Skills | ||||||
| i.. | Learning Skills and Innovation | 4.28 | 4.20 | 4.21 | 4.27 | 4.25 |
| ii.. | Media and Technology Skills | 4.00 | 4.20 | 4.22 | 4.30 | 4.29 |
| iii.. | Skills in Living and Profession | 4.56 | 4.61 | 4.63 | 4.60 | 4.62 |
| Total Mean Score | 4.21 | 4.30 | 4.31 | 4.34 | 4.35 | |
Faculty of Education
School Mentor’s and University’s Supervisor Evaluation Summary of our Senior Students
A.Y. 2025
Table 1: Summary of School Mentor’s Evaluation of our Senior Students based on Four (4) Program Learning Outcomes:
| Learning Outcomes | Mean | Remark |
| 1. Knowledge | 3.98 | High Satisfaction |
| 2. Skills | 3.69 | High Satisfaction |
| 3. Ethics | 3.96 | High Satisfaction |
| 4. Character | 3.77 | High Satisfaction |
| Overall Mean Score | 3.85 | High Satisfaction |
Evaluation Summary
Table 1 shows the performance of our senior students based on the mentor’s evaluation across four key-competencies: Knowledge, Skills, Ethics, and Character. The overall mean score for these evaluations is also considered to provide a comprehensive understanding of the students’ capabilities.
Knowledge (3.98)
This is the highest-scoring competency, suggesting that the students have a solid understanding of the theoretical and practical knowledge relevant to their field. This high score reflects the effectiveness of the curriculum and the students’ commitment to their studies.
Skills (3.69)
Students show good cognitive abilities, indicating their capacity to think critically and solve problems effectively. They exhibit reasonable interpersonal skills. They have less effective communication, teamwork, and relationship-building skills. Their abilities to analyze data, perform calculations, and apply quantitative reasoning need care. They performed well in managing their learning processes. This reflects their ability to organize, plan, and execute their learning activities efficiently, contributing to their academic success. Overall, they need some improvement in skills for effectiveness.
Ethics (3.96)
The students demonstrated a strong adherence to moral and ethical standards. This score indicates that they are generally reliable, responsible, and demonstrate integrity in their actions.
Character (3.77)
This score exhibit that students have very good character towards their family, fellow friends, students, colleagues, and seniors, organization, society and the country (nation)
Overall Performance
Recommendations The overall mean score of 3.85 indicates a generally strong performance by the senior students. They excel particularly in Knowledge and some aspects of Skills, which are critical for academic success and professional development. However, there is a noticeable need for improvement in some aspects of Skills to ensure a well-rounded competency profile.
Skills:
Implement workshops and group activities focusing on communication, teamwork, and conflict resolution to help students improving their skills.
Conclusion
The mentor’s evaluation reveals that senior students are performing well, with particular strengths in Knowledge, some aspects of Skills and Ethics. Addressing the areas of some aspects of skills like Interpersonal and Numerical & Analytical Skills through targeted initiatives will help in developing a more balanced and comprehensive skill-set, preparing students effectively for future challenge
. Table 2: Summary of University’s Supervisor Evaluation of our Senior Students based on Four (4) Program Learning Outcomes:
| Learning Outcomes | Mean | Remark |
| 1. Knowledge | 3.67 | High Satisfaction |
| 2. Skills | 3.60 | High Satisfaction |
| 3. Ethics | 3.96 | High Satisfaction |
| 4. Character | 3.73 | High Satisfaction |
| Overall Mean Score | 3.74 | High Satisfaction |
Table 2 shows the performance of senior students based on the university supervisor’s evaluation across four key-competencies: Knowledge, Skills, Ethics, and Character.
Knowledge (3.67)
This score shows that students have a good grasp of theoretical and practical knowledge. Although slightly lower compared to other competencies, it still indicates a solid understanding of their subject matter, but have some scope of improvement for future development.
Skills (3.60)
Students demonstrate effective but less abilities, including critical thinking and problem-solving skills. This score reflects their capacity to apply their knowledge practically. They exhibit reasonable interpersonal skills. They have strong communication, teamwork, and relationship-building skills. They have good abilities to analyze data, perform calculations, and apply quantitative reasoning. They performed well in managing their learning processes. This reflects their ability to organize, plan, and execute their learning activities efficiently, contributing to their academic success. Overall, they need some improvement in skills for effectiveness.
Ethics (3.96)
This is the highest score exhibiting that students display a strong sense of moral and ethical responsibility. This score indicates a consistent level of integrity and ethical behavior among the students.
Character (3.73)
This score exhibit that students have strong character towards their family, fellow friends, students, colleagues, and seniors, organization, society and the country (nation).
Overall Performance
The scores reflect a generally strong performance by the senior students, with particular strengths in Ethics. Skills has less score but it being an average score, it exhibits an skills as in some aspects have good and in some have less. On average they have an average skill set. The slightly lower score in Knowledge suggests room for enhancement, but it still represents a solid understanding.
Conclusion
The university supervisor’s evaluation indicates that senior students are well-prepared in most competencies, with a particular strength in Interpersonal Skills. Focusing on further developing their Knowledge while maintaining their strong interpersonal and other skills will help ensure they are comprehensively prepared for future academic and professional challenge.
Conclusion of Mentor and University Supervisor Evaluation Results
The evaluations by both the mentor and the university supervisor provide a comprehensive assessment of the senior students’ competencies. By comparing these evaluations, we can draw several key insights:
Comparison of Evaluation Scores
| Competency – | Mentor’s Score | Supervisor’s Score |
| 1. Knowledge | 3.98 | 3.67 |
| 2. Skills | 3.69 | 3.60 |
| 3. Ethics | 3.96 | 3.96 |
| 4. Character | 3.77 | 3.73 |
| Overall Mean Score | 3.85 | 3.74 |
Key Findings
Ethics:
Both evaluations show a strong adherence to moral and ethical standards, with very same scores (3.96 by both the mentor and the supervisor).
Knowledge:
The mentor’s evaluation shows a significantly higher score (3.98) compared to the supervisor’s evaluation (3.67), indicating a discrepancy in the perceived level of students’ theoretical and practical knowledge.
Skills:
Both evaluations are closely aligned (3.69 by the mentor and 3.60 by the supervisor), suggesting a consistent view of students’ overall skills in all aspects.
Overall Performance
Strengths:
Both evaluations highlight strong Ethics.
The mentor emphasizes strengths in Knowledge.
Both supervisor and mentor highlight average strength in Skills; some aspects mentor considered better and some aspects supervisor enlighten.
Areas for Improvement:
Overall lower scores in Skills by the mentor and the supervisor, indicate a need for the development in this area.
The discrepancy in Knowledge scores suggests a need for a more unified approach to enhancing students’ understanding and application of theoretical concepts.
Conclusion
The evaluations by both the mentor and the university supervisor reveal that senior students possess a well-rounded set of competencies, with particular strengths in different areas according to each evaluator. The mentor sees the greatest strengths in Knowledge and Learning Management Skills, while the supervisor emphasizes Interpersonal Skills and Numerical & Analytical Skills. To address these evaluations effectively, focusing on enhancing Interpersonal Skills and bridging the gap in Knowledge will be key to ensuring students are comprehensively prepared for their future endeavor
Output and Outcomes Benchmarking for AUN-QA 2025
Benchmarking against Thai, Indian, and International Universities – in line with AUN-QA Criterion 9.
| Key Indicators | St. Teresa International University (Data for 2025-2026) | Thai Universities (Comparative Benchmark) | Indian Universities (Comparative Benchmark) | International Benchmark (e.g., UK, Australia, Japan) | Remarks / Recommendations |
| Total Student Capacity | 30 | Varies (20-50 per cohort) | Varies (30-100+ per cohort) | Varies (25-40 per cohort) | Capacity reflects a focus on small class sizes and personalized instruction. |
| Students Admitted | 2 | Moderate to full intake | High intake in central/state universities | Moderate to full intake | Very low initial enrolment. Urgent need for marketing and recruitment strategy. |
| Pass Rate (%) | 100 % | 88–92% | 85–90% | 92–96% | High pass rates are expected with small cohorts and personalized support. Monitor closely. |
| Dropout Rate (%) | Nil | 5–8% | 8–12% | 3–5% | Proactive academic advising and mentorship are critical for retention from the first year. |
| Average Time to Graduate (Years) | 4-Year Programme | 4.2 – 4.5 Years | 4.0 – 4.5 Years | 3.8 – 4.0 Years | Monitor student progress closely to ensure on-time graduation. |
| Employability Rate (within 6 months) | 100% | 80–85% | 70–80% | 90–95% | With only 2 students, a 100% rate is achievable. Focus on quality of employment and school placements. |
| Self-employment / Entrepreneurship Rate (%) | 0 % | 5–8% | 8–12% | 10–15% | Niche area for math graduates (e.g., ed-tech, tutoring). |
| Advancement to Further Studies (%) | Data pending | 10–15% | 10–15% | 20–25% | For a small cohort, even 1 student pursuing a Master’s would be a significant 50% rate. Encourage this path. |
| Student Research & Creative Work Participation (%) | 55% (Initial Cohort) | 30–50% | 20–30% | 50–70% | Introduce research methodology early. A compulsory final-year project/thesis can drive this indicator. |
| Academic Staff Research Output (Avg. Publications / Year) | 2 | 1.5–2.5 | 1.0–2.0 | 3.0–5.0 | Current output is on par with Thai peers. To meet international benchmarks, incentivize Scopus/WoS publications and international collaboration. |
| Student Participation in Outreach/Extension Activities (%) | 60% (Initial Cohort) | 40–60% | 30–50% | 60–80% | Integrate community-based projects into the curriculum (e.g., math clinics in local schools). |
| Student Satisfaction (%) | Data pending | 84–88% | 80–85% | 88–92% | Plan for first satisfaction survey at the end of Year 1. |
| Alumni Satisfaction (%) | Data pending | 78–82% | 75–80% | 85–90% | N/A until first graduates. Build alumni relations from day one. |
| Employer Satisfaction (%) | Data pending | 75–80% | 70–78% | 85–90% | Engage with potential employers (schools) early through advisory boards and internships. |
| Academic Staff Satisfaction (%) | 91% | 80–85% | 75–82% | 85–90% | Excellent score. Leverage this to retain quality staff and attract new talent. |
| Participation in International Collaboration / Exchange (%) | 0% (Staff), 33 – 50% (Students) | 10–15% (Staff), 5–10% (Students) | 5–10% (Staff), 2–5% (Students) | 20–30% (Staff), 15–25% (Students) | A key area for growth. Explore virtual exchange, COIL projects, and joint research with partner universities. |
Summary:
The Bachelor of Education in Mathematics (BEDM) programme at St. Teresa International University is at a foundational stage. With an intake of only 2 students in the 2025-2026 academic year against a capacity of 30, the primary challenge is recruitment and visibility. While outcome data for this new cohort is pending, the programme benefits from a very high academic staff satisfaction rate (91%), which is a strong foundation for quality delivery.
The programme is positioned within a highly competitive landscape. Thai public universities (e.g., Chulalongkorn, Thammasat, Kasetsart) typically enjoy high enrolment and have well-established employer networks. Indian universities produce a high volume of graduates, with a focus on pedagogical theory. Top international benchmarks, particularly in the UK and Finland, emphasize research-led teaching, strong internationalization, and early integration of students into school placements.
Strategic Focus for 2025-2026:
Given the unique position of having only 2 students, the programme has a rare opportunity to pilot a highly personalized, high-impact educational model. The immediate focus should be on retention and demonstrating exceptional value to attract the next cohort.
Recommendations for Improvement:
- Intensive Recruitment & Marketing: Develop a targeted marketing campaign highlighting the benefits of a small cohort (personalized attention, strong faculty-student ratio), scholarship opportunities, and unique selling points (e.g., international exposure, specialized math pedagogy). Engage with high schools directly.
- Design a “Flagship” Student Experience: For the two admitted students, create a personalized enriched curriculum. This could include a guaranteed international virtual collaboration project, a paid teaching assistantship, or a mentored research project. This will serve as a powerful case study for future recruitment.
- Build International Bridges: Initiate a “Collaborative Online International Learning” (COIL) project with a partner university in Japan, Europe, or ASEAN. This immediately addresses the 0% international participation rate and provides a global experience for the students without requiring travel.
- Leverage Staff Satisfaction for Research Output: Utilize the highly satisfied academic staff to form a focused research cluster in Mathematics Education. Set a target for one joint publication between staff and the students (as co-authors) within the next two years. This builds research capacity and student engagement simultaneously.
- Develop an Industry Advisory Board: Even with a small cohort, establish a board comprising heads of mathematics departments from local international and reputable Thai schools. This will build employer relationships early, inform curriculum design, and create a pipeline for future internships and jobs.
Evidence
| ID_Evidence | Name_Evidence |
| 8.1 | List of Graduates MIS System Student Profile Student Monitoring System |
| 8.2 | 2023 Graduate Employment Record Student Award |
| 8.3 | Faculty of Education Academic Expo Student Activities and Student-led projects |
| 8.4 | Students & Alumni Performance that directly show the achievement of the Programme Outcomes Learning Outcomes: Survey from employers 1 TOEIC Exam Scores 2 Government Exam for Assistant Results 3 Student Awards & Recognitions 4 Employer’s Satisfaction Results |
| 8.5 | Results of Various Stakeholders Satisfaction towards our Alumni and Graduating Students Stakeholder’s Satisfaction Results 1 Employers Satisfaction Survey Results 2 School Mentor & University Supervisor Evaluation Result Employers Satisfaction Survey Graduating Students Evaluation Results Graduating Students Evaluation Results |
Self-Assessment
| Requirements | Result | Score |
| 8.1 The pass rate, dropout rate, and average time to graduate are shown to be established, monitored, and benchmarked for improvement. | / | 1 |
| 8.2 Employability as well as self-employment, entrepreneurship, and advancement to further studies, are shown to be established, monitored, and benchmarked for improvement. | / | 1 |
| 8.3 Research and creative work output and activities carried out by the academic staff and students, are shown to be established, monitored, and benchmarked for improvement. | / | 1 |
| 8.4 Data are provided to show directly the achievement of the programme outcomes, which are established and monitored. | / | 1 |
| 8.5 Satisfaction level of the various stakeholders are shown to be established, monitored, and benchmarked for improvement. | / | 1 |
| Overall | 5 | |